See your business in real time - on one screen.
Stop waiting for Monday-morning reports. We connect your accounting, ERP, CRM and ops data sources to live Microsoft Power BI dashboards so leadership has the answer before the question is asked.
This is what your Monday-morning review will look like.
Every Power BI dashboard we deliver is built in the Microsoft Power BI Service - it works in any browser, in Microsoft Teams, and on the Power BI mobile app. Below is a typical executive view.
- KPI cards with trend vs prior period
- Drill-through from total → branch → voucher
- Bookmarks & slicers - filter by region, salesperson, period
- Row-level security - people see only their data
- Mobile alerts when a KPI breaches a threshold
- Export to PowerPoint / PDF / Excel in one click
The Power BI experience, in the real world
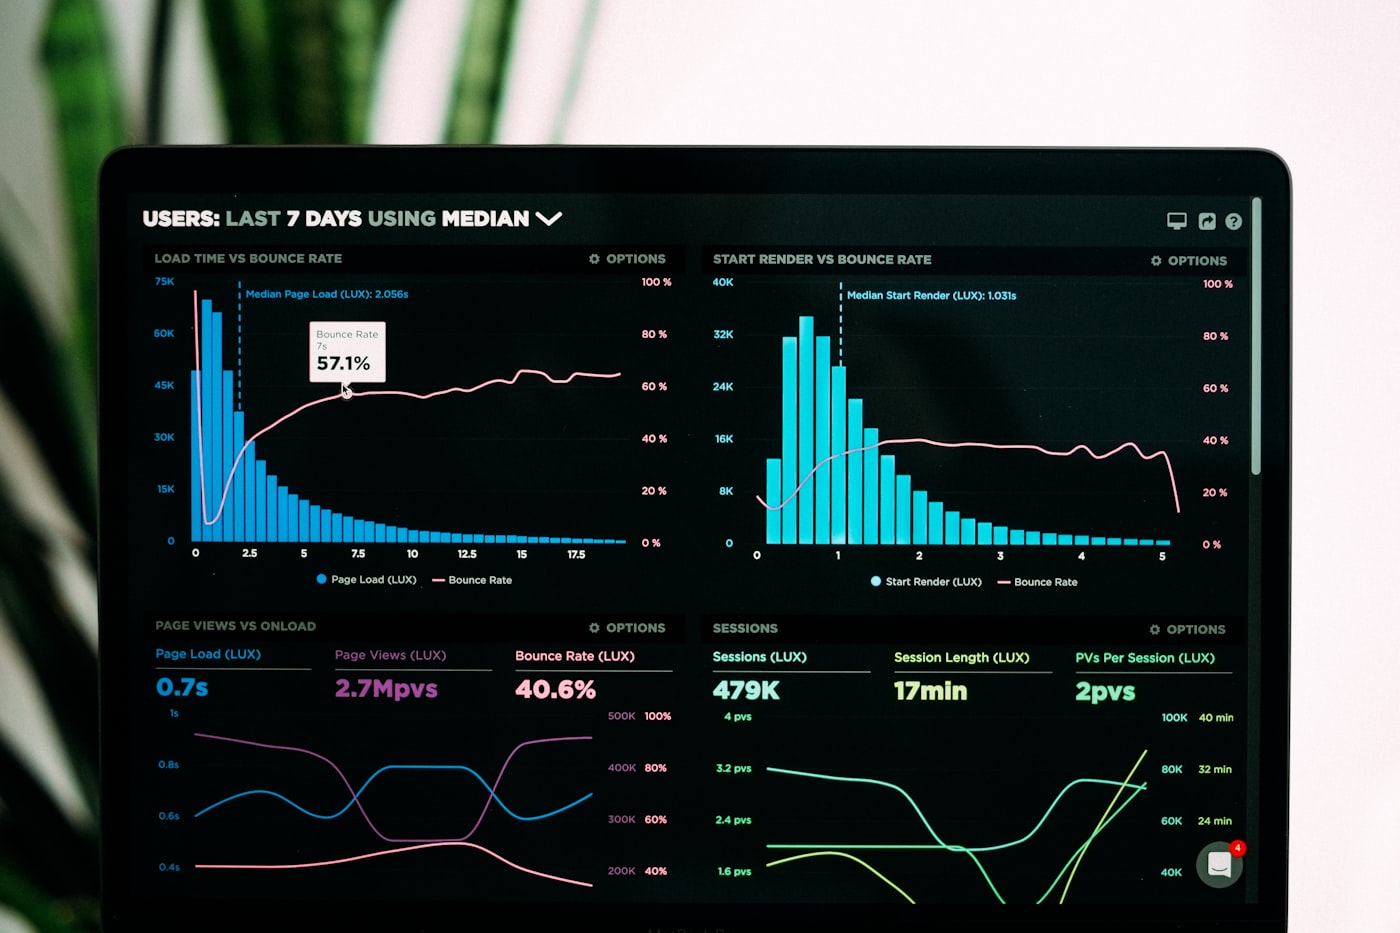
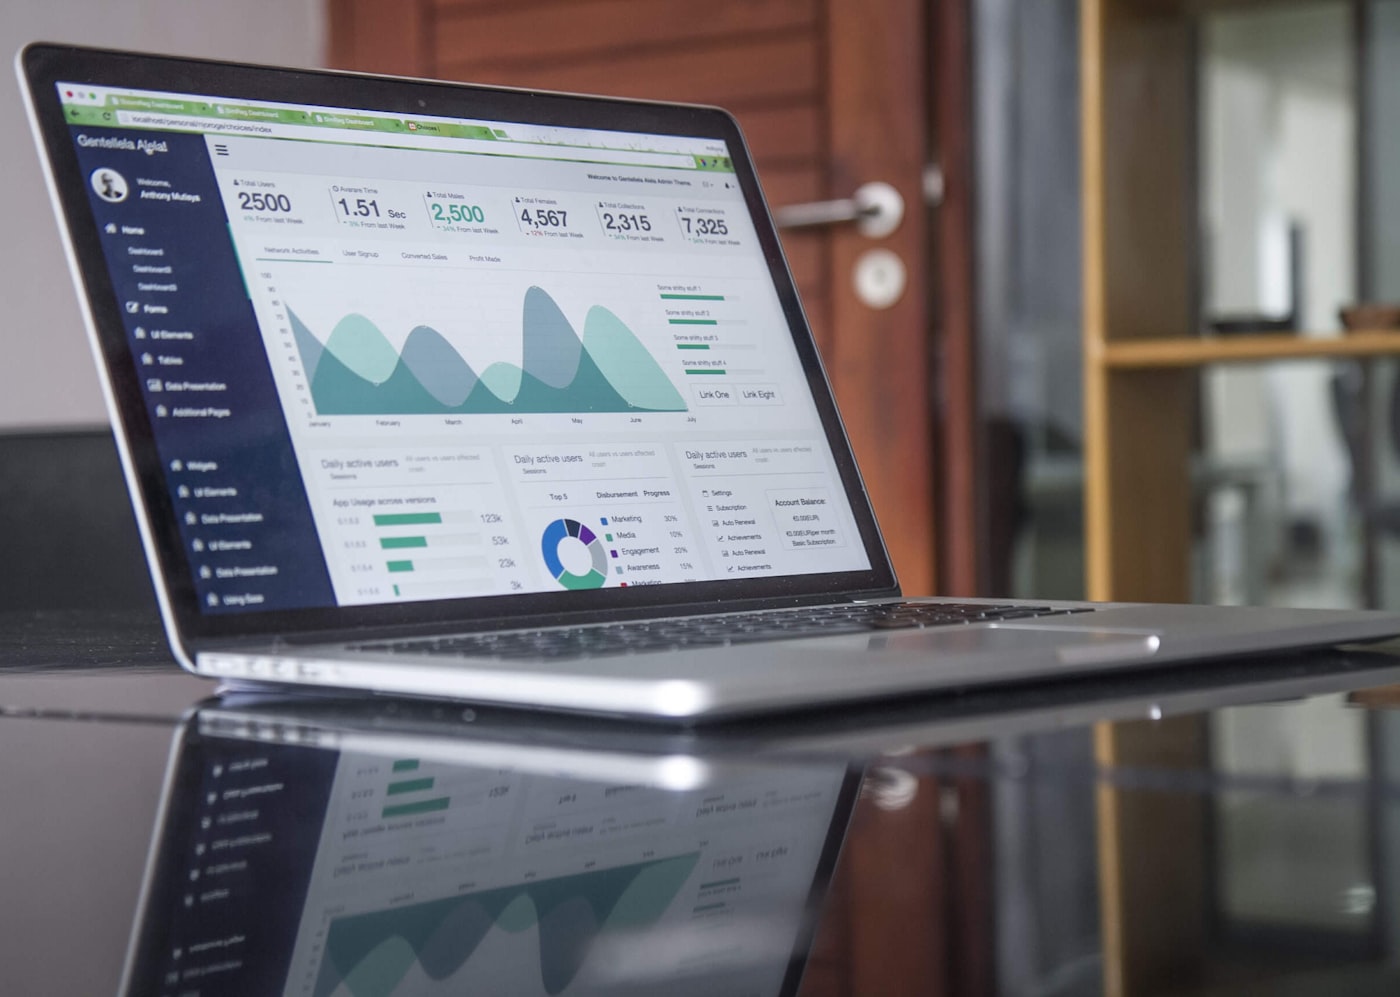
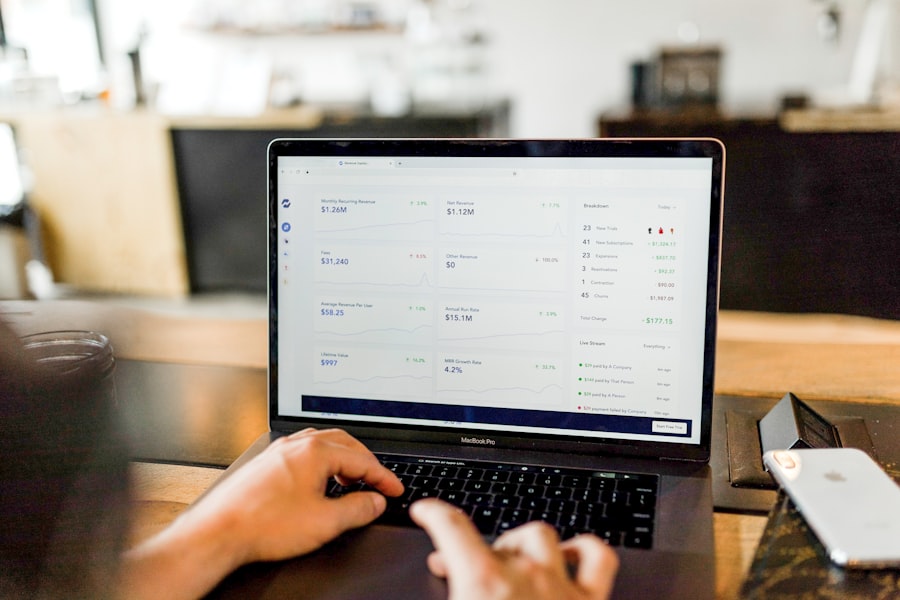


Photos for illustration. Swap any tile by replacing the file in images/powerbi/ with your own dashboard screenshot - the layout adjusts automatically.
Built on Microsoft Power BI & Fabric
"We have data everywhere - and visibility nowhere."
If anyone in your leadership team has said these things this quarter, you're already overdue for a dashboard conversation.
- "There are 12 versions of Sales_Final_FINAL_v3.xlsx and the numbers don't agree."
- "We can't see live debtor ageing without exporting from Tally / Zoho / Dynamics."
- "Branch managers see each other's P&L. Awkward."
- "Friday-night extracts, Saturday cleanup, Monday review - decisions are a week late."
- "Only one analyst knows the formulas. If she leaves, we're in trouble."
What's included in every engagement
- Discovery workshop - KPIs that actually drive your business
- Star-schema data model (no spaghetti DAX)
- Dashboards for finance, sales, ops, HR or marketing
- Source connectors (Tally / Dynamics / SAP / Zoho / SQL / Excel / GA4 / SharePoint)
- Power BI gateway for on-prem refresh
- Row-level security & workspace governance
- Mobile alerts on KPI thresholds
- 2 sessions report-consumer + 2 sessions report-author training
- 30-day post-go-live hypercare
Accounting, ERP & CRM platforms we connect to Power BI
Don't see yours? Ask usIndian accounting / ERP
Tally Prime & ERP 9
Via TDL extract, ODBC connector or scheduled CSV. Bridges to GST, debtor ageing, branch P&L.
Zoho Books / Inventory
Native Zoho Analytics + Power BI via REST API. Live sales, AR/AP, inventory.
Microsoft Dynamics 365
Business Central
Native Power BI app, prebuilt finance/sales reports, Dataverse for one-click model.
Finance & Operations
Entity store + BYOD or Synapse Link to Power BI for enterprise finance, supply chain, projects.
Sales (CRM)
Dataverse direct query - pipeline, win-rate, lead source attribution.
Customer Service
SLA adherence, CSAT, agent productivity, case ageing dashboards.
Field Service
Technician utilisation, first-time-fix, parts consumption analytics.
Customer Insights (Journeys & Data)
Unified customer profiles → segmentation → Power BI marketing dashboards.
Already on Microsoft Dynamics 365?
You're sitting on a goldmine. Dataverse plugs straight into Power BI - we can stand up your first 3 governed finance/sales dashboards in 2-3 weeks, with row-level security tied to your Entra ID groups.
Global accounting & ERP
QuickBooks Online / Desktop
Live API for Online; ODBC for Desktop. Standard finance pack in 1-2 weeks.
CRM, e-commerce & data sources
Salesforce
Native connector. Pipeline, forecast, AE leaderboard, churn analytics.
Shopify / WooCommerce
Orders, AOV, refunds, ad-spend ROAS dashboards.
Google Analytics 4
GA4 BigQuery export → Power BI for web/marketing analytics.
SQL Server / MySQL / Postgres
Direct query or import; on-prem via Power BI gateway.
Excel & SharePoint
Curate spreadsheets into governed datasets - retire the "Final_v3" files.
How we work - live in 4-6 weeks
1. Discovery
2-hour session per business function. We document KPIs, sources and the decisions they support.
2. Data model
Star schema, conformed dimensions, documented measures - the foundation everyone trusts.
3. Build & iterate
You see screens every week. We refine the visuals, slicers and bookmarks together.
4. Security & rollout
Row-level security, workspace setup, Teams app, mobile, training for consumers and authors.
5. Run & iterate
Monthly review, new requests and tuning - or a clean handover to your team.
Indicative pricing
See all services pricing3 dashboards
From ₹ 55,000
One source, one business function- 1 data source (e.g. Tally or Dynamics)
- Star-schema data model
- 3 published reports + mobile
- 2 training sessions
Business pack
From ₹ 1,25,000
Multi-source, multi-function- Up to 3 sources (Tally + Dynamics + Excel etc.)
- 8 dashboards across finance / sales / ops
- Row-level security + Teams app
- 4 training sessions + 30-day hypercare
Lakehouse + governed BI
Custom
Microsoft Fabric, semantic models, certified datasets- Microsoft Fabric lakehouse / warehouse
- Certified semantic models
- CI/CD with deployment pipelines
- Managed BI operations (monthly)
All prices are in INR, excluding 18% GST. Power BI Pro (per user), Premium Per User and Premium capacity / Microsoft Fabric SKUs are billed separately at MRP or under our Microsoft CSP. Travel for on-site workshops outside Bengaluru chargeable at actuals.